Difference between revisions of "Strategy Nt"
| Line 7: | Line 7: | ||
'''Buy''' | '''Buy''' | ||
| − | + | To open a buy order, you need to wait until the up arrow appears on the bottom Nina indicator. A green bar should appear in the histogram of the Hist StepMA Stoch indicator. You can only buy if the candle is above the exponential average. Otherwise, you cannot enter the market. You can see an example of a buy signal below. | |
[[File:NT1.png]] | [[File:NT1.png]] | ||
| − | + | Close the purchase when the histogram captures the red column. | |
| − | ''' | + | '''Sell''' |
Правила для продаж аналогичны, но противоположны. Индикатор Nina р, но уже сверху вниз,сует стрелку вниз. Столбцы гистограммы меняют свой цвет на красный, а непосредственно сама цена (свеча) находится выше уровня ЕМА с периодом 50. | Правила для продаж аналогичны, но противоположны. Индикатор Nina р, но уже сверху вниз,сует стрелку вниз. Столбцы гистограммы меняют свой цвет на красный, а непосредственно сама цена (свеча) находится выше уровня ЕМА с периодом 50. | ||
Revision as of 09:53, 25 August 2019
Forex Nt Strategies on the M30 relate to short-term trading systems. Signals at this time period appear quite often and are quickly processed. By increasing the total number of transactions, the number of unprofitable positions is also increasing. Works on any tools.
Let's look at an example.
To trade according to the system, you need to set three indicators on the chart of the currency pair - the standard exponential moving average with a period of 50, the Hist StepMA Stoch indicator and the aNina v1 indicator. Indicators and instrument template you can download.
Buy
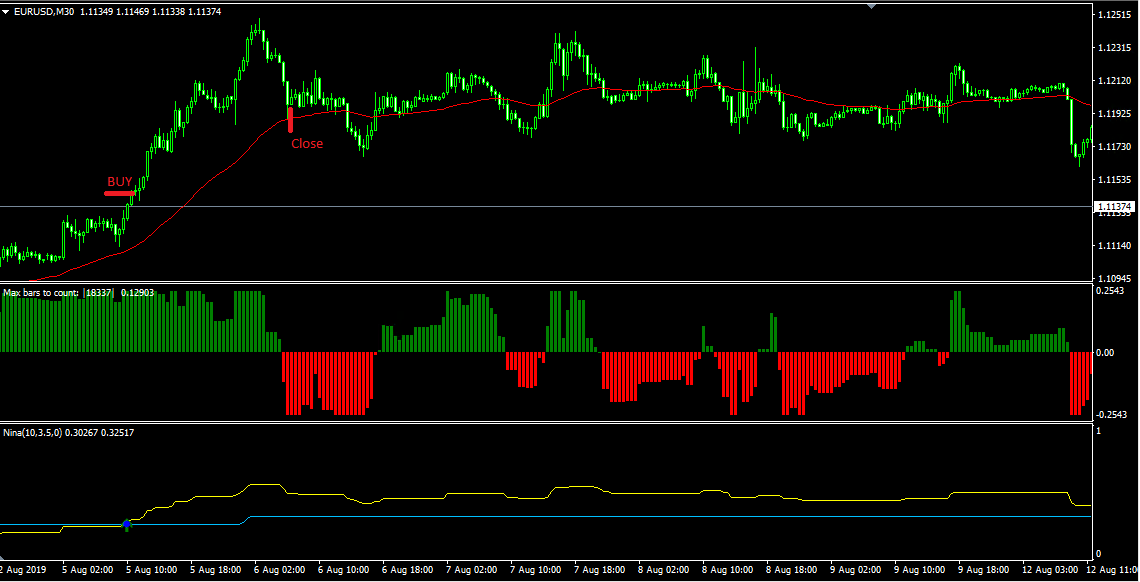
To open a buy order, you need to wait until the up arrow appears on the bottom Nina indicator. A green bar should appear in the histogram of the Hist StepMA Stoch indicator. You can only buy if the candle is above the exponential average. Otherwise, you cannot enter the market. You can see an example of a buy signal below.

Close the purchase when the histogram captures the red column.
Sell
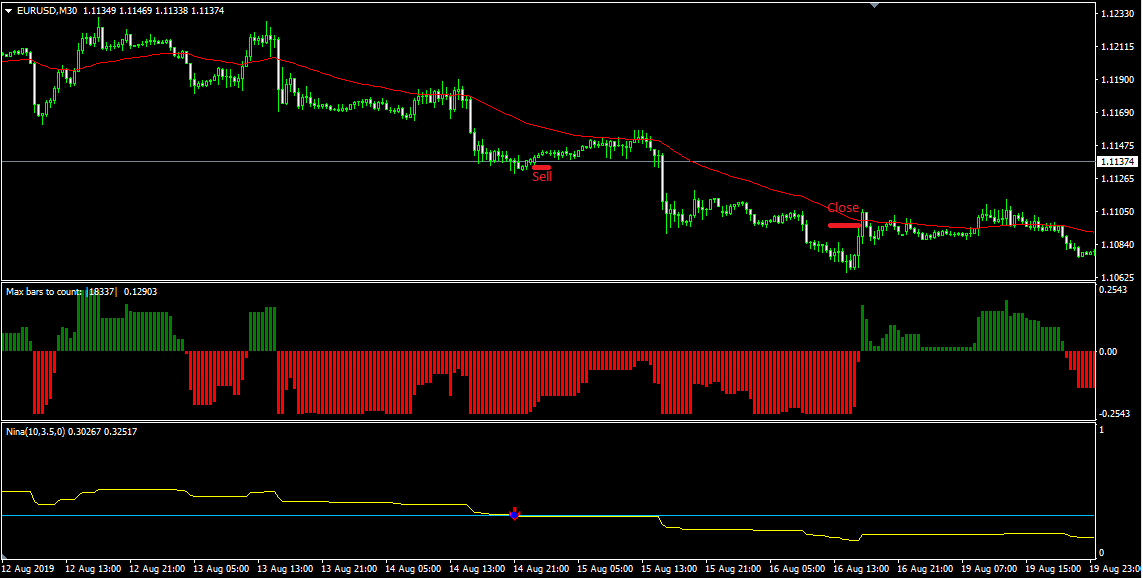
Правила для продаж аналогичны, но противоположны. Индикатор Nina р, но уже сверху вниз,сует стрелку вниз. Столбцы гистограммы меняют свой цвет на красный, а непосредственно сама цена (свеча) находится выше уровня ЕМА с периодом 50.

Закрываем сделку когда гистограмма фиксирует зеленый столбец.
SL устанавливаем при покупке ниже скользящей средней, при продаже выше скользящей средней.