Difference between revisions of "Strategy 5000 pips"
| Line 19: | Line 19: | ||
5. MACD - fast EMA 8, slow EMA 21, MACD SMA 1. Apply to Weighted Close (HLCC / 4). | 5. MACD - fast EMA 8, slow EMA 21, MACD SMA 1. Apply to Weighted Close (HLCC / 4). | ||
| − | + | The position opens when we see the intersection of the moving average (8) of the moving average (21). | |
| − | + | Additionally: | |
| − | 1. | + | 1. when the Parabolic SAR indicator forms the level of price support, i.e. Parabolic is below the price - we are opening a long position. If the indicators are above the price - a short position. |
| − | 2. | + | 2. the red moving average crosses the blue from bottom to top - a condition for buying, from top to bottom - selling. |
| − | 3. | + | 3. when the Parabolic SAR indicator forms a price resistance level, i.e. Parabolic is above the price - we are opening a short position. |
| − | 4. | + | 4. MACD indicator is used to avoid false trading signals when opening positions. That is, he must confirm the signals from moving averages on the chart. This means that the indicator bars are small - evidence of the beginning of a trend. |
| − | 5. Stochastic. | + | 5. Stochastic. Do not enter into deals with Stochastic overbought or oversold signals. In other words, when opening a deal, the indicator should be within 20-80%. |
| − | + | Exit the market: | |
| − | 1. | + | 1. If you have a long order (buy) open, the signal to exit the position will be the formation of a parable on the opposite side of the trend (from the bottom of the chart). |
| − | 2. | + | 2. If you have a short order (sale) open, the signal to exit the position will be the formation of a parabolic above the price. |
| − | + | You also need to exit the market if, on the chart, our moving averages intersect in the opposite direction relative to the moment we entered the market. The chances that the moving ones will change their direction are small, since the Stochastic indicator is the first to give the signal to exit the position in most cases. | |
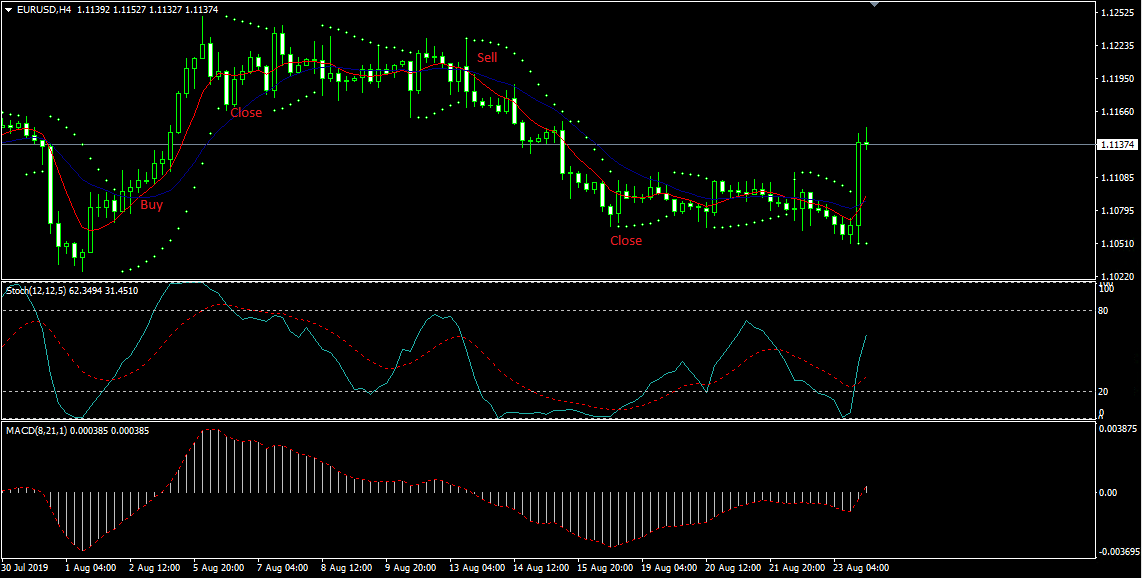
| − | + | Consider an example. | |
[[File:5000pips.png]] | [[File:5000pips.png]] | ||
Revision as of 19:07, 25 August 2019
Timeframe: h4
Tool: All trading tools
Minimum deposit: 300 $
Minimum Lot: 0.01
The "5000 points" strategy based on indicators gives a profit of 3500-5000 points per month. The strategy is simple and uses the standard indicators in Metatrader 4: Lіneаr Weіghted Moving Аverage, Parаbolic SAR, MACD and the Stochastic oscillator.
Let's analyze the example on EURUSD, but you can use any currency pairs, as well as Gold and CFD, although the settings need to be selected individually.
The indicator settings for the trading strategy are shown below: 1. linear weighted moving average (Lіneаr Weіghted Moving Аverage) - period 8, shift 0, apply to the average price (Typіcal Prіce - HLC / 3), color red. 2. linear weighted moving average (Lіneаr Weіghted Moving Аverage) - period 21, shift 0, apply to the average price (Typіcal Prіce - HLC / 3), color blue. 3. Parabolic SAR - step 0.0026, maximum 0.5. 4. Stochastic Oscillator - period %K 12, period %D 12, slowdown 5. Prices, select Close/Close. MA method select Exponential. Be sure to set checkbox “fixed minimum 0” and “maximum 100” We also need to set additional levels - 20 and 80, the others (most often worth level 50) is removed. 5. MACD - fast EMA 8, slow EMA 21, MACD SMA 1. Apply to Weighted Close (HLCC / 4).
The position opens when we see the intersection of the moving average (8) of the moving average (21). Additionally: 1. when the Parabolic SAR indicator forms the level of price support, i.e. Parabolic is below the price - we are opening a long position. If the indicators are above the price - a short position. 2. the red moving average crosses the blue from bottom to top - a condition for buying, from top to bottom - selling. 3. when the Parabolic SAR indicator forms a price resistance level, i.e. Parabolic is above the price - we are opening a short position. 4. MACD indicator is used to avoid false trading signals when opening positions. That is, he must confirm the signals from moving averages on the chart. This means that the indicator bars are small - evidence of the beginning of a trend. 5. Stochastic. Do not enter into deals with Stochastic overbought or oversold signals. In other words, when opening a deal, the indicator should be within 20-80%.
Exit the market: 1. If you have a long order (buy) open, the signal to exit the position will be the formation of a parable on the opposite side of the trend (from the bottom of the chart). 2. If you have a short order (sale) open, the signal to exit the position will be the formation of a parabolic above the price. You also need to exit the market if, on the chart, our moving averages intersect in the opposite direction relative to the moment we entered the market. The chances that the moving ones will change their direction are small, since the Stochastic indicator is the first to give the signal to exit the position in most cases.
